Sample Size and Variance
One of the advantages to R over a program such as SPSS is that you can save a script - a computer program - a series of R commands that can be repeated over and over as needed. In this assignment we will learn how to make scripts in addition to learning about the relationship between sample size and variance.
1. Clear your R Studio workspace. Do this from the Menu at the top: Session --> Clear Workspace. Check the box to clear hidden objects.
2. Open up a new R script: File --> New File --> R script.
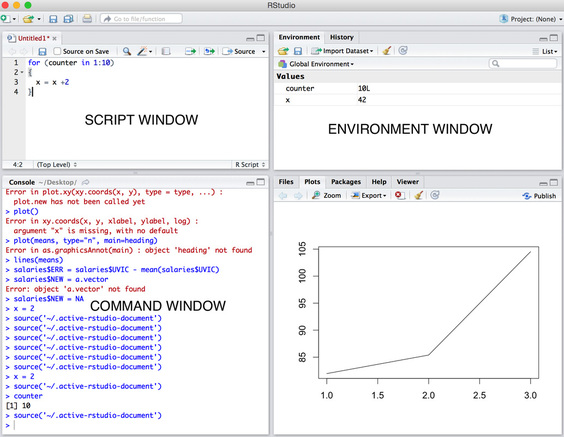
3. On the first line of your new script, type: x = x + 2. Hint, the script window is in the top left and should say Untiled1* in red at the top.
4. Now, switch to the main command window and type: x = 0. This sets a variable called x to be equal to 0.
5. Find the variable x in the Environment window. It should have a value of 0.
6. Go back to the script window and look closely for the word "Source" (HINT: not Source of Save). It should be to the right and have a white square with a blue arrow coming out of it beside it. Click Source.
7. Find the variable x in the Environment window. It should now have a value of 2. Click on the Source button a few times. Each time you do, you should see that x increases by 2. This is because each time you run your program, it executes the code x = x + 2.
8. Delete the line x = x + 2 from your script.
9. Okay, now it is time to explain another R component - the "for" loop. Loops are used in programming to execute the same command over and over again. You will see why this is useful in a bit.
10. Type x = 0 in the command window again. Check the Environment window to make sure x is equal to 2.
11. Type the following code into your script:
for (counter in 1:10)
{
x = x +2
}
This is a for loop in R. Before we run it lets pull it apart.
The first line tells R that it is a for loop. The for loop will run from 1 to 10, and each time it "loops" the variable counter will have a value that is the current loop number (i.e., counter = 1 for the first loop, counter = 2 for the second loops, etc).
The second line is the open bracket {. This tells R that all the code until the } is in the loop.
So, this loop will execute the command x = x + 2 10 times. Try running the loop - x should be equal to 20 after you hit Source. Do not go further until you understand for loops and you have this working. You can read the page HERE for more information on for loops.
10. Okay, we are now going to use the for loop combined with commands from previous assignments to complete this assignment. Type the following code into a new R script (you can delete the previous code now).
sample.data = NA
sample.means = NA
for (counter in 1:100)
{
sample.data = rnorm(10,300,25)
sample.means[counter] = mean(sample.data)
}
Okay, before we begin the assignment lets discuss what this script does.
First, it creates two variables, sample.data and sample.means. It assigns these variables the value NA (the empty set).
Second, it creates a loop that loops 100 times.
Third, within the loop, it first creates a sample of random normally distributed data with 10 values, a mean of 300, and a standard deviation of 25.
Fourth, it takes the mean of this new sample and puts it into the variable sample.means in the position that is currently the counter. Thus, on the first iteration of the loop, this would be sample.means[1].
Run the code. You should see that sample.means has 100 elements in it - the means of the 100 samples that were created. Try this: plot(sample.means). You will see a graphic representation of the sample means of your 100 samples.
11. You could compute the variance of these sample means by typing: var(sample.means).
12. You can save this script by hitting the little computer disc button in the script window. You will be prompted to give the script a name.
Assignment Question
Using the code above and the previous assignments, demonstrate that the variance of sample means decreases with increasing sample size. Your submitted assignment must meet the following criteria:
1. You must test the following sample size (5, 10, 50, 100, 1000, 10000).
2. Your test must be of 100 samples of each sample size.
3. You must include a plot of the 6 sets of sample means (HINT: use the par command to make a 2 by 3 figure).
4. You must compute the variance of each of your 6 sets of sample means and report these values.
5. You must include a second figure which is a plot of the 6 variances.
6. You must submit by email a R script file that completes steps 1 through 5. Specifically, I will be able to run the script and see the answers to 1 through 5 as output.
7. In your email, you must also answer in words:
a. The relationship between sample size and variance about the population mean.
b. Explain why variance about the mean decreases with sample size. Do not copy and paste from Wikipedia - use your own words - look at your figures and think about it. Feel free to write an additional script to prove your point mathematically.
c. Explain why this is important experimentally - why is having a bigger sample size better when doing quantitative research?
NOTE. This is your first challenging assignment. It will require quite a bit of thought and work but all of the R commands you need are in these first 5 assignments. I will help you with concepts, but I will not provide you with more code. Also, it is important you learn how to code this assignment yourself. You could find a R expert and they would help you, but on the exam you will need to be able to do something like this on your own.
1. Clear your R Studio workspace. Do this from the Menu at the top: Session --> Clear Workspace. Check the box to clear hidden objects.
2. Open up a new R script: File --> New File --> R script.
3. On the first line of your new script, type: x = x + 2. Hint, the script window is in the top left and should say Untiled1* in red at the top.
4. Now, switch to the main command window and type: x = 0. This sets a variable called x to be equal to 0.
5. Find the variable x in the Environment window. It should have a value of 0.
6. Go back to the script window and look closely for the word "Source" (HINT: not Source of Save). It should be to the right and have a white square with a blue arrow coming out of it beside it. Click Source.
7. Find the variable x in the Environment window. It should now have a value of 2. Click on the Source button a few times. Each time you do, you should see that x increases by 2. This is because each time you run your program, it executes the code x = x + 2.
8. Delete the line x = x + 2 from your script.
9. Okay, now it is time to explain another R component - the "for" loop. Loops are used in programming to execute the same command over and over again. You will see why this is useful in a bit.
10. Type x = 0 in the command window again. Check the Environment window to make sure x is equal to 2.
11. Type the following code into your script:
for (counter in 1:10)
{
x = x +2
}
This is a for loop in R. Before we run it lets pull it apart.
The first line tells R that it is a for loop. The for loop will run from 1 to 10, and each time it "loops" the variable counter will have a value that is the current loop number (i.e., counter = 1 for the first loop, counter = 2 for the second loops, etc).
The second line is the open bracket {. This tells R that all the code until the } is in the loop.
So, this loop will execute the command x = x + 2 10 times. Try running the loop - x should be equal to 20 after you hit Source. Do not go further until you understand for loops and you have this working. You can read the page HERE for more information on for loops.
10. Okay, we are now going to use the for loop combined with commands from previous assignments to complete this assignment. Type the following code into a new R script (you can delete the previous code now).
sample.data = NA
sample.means = NA
for (counter in 1:100)
{
sample.data = rnorm(10,300,25)
sample.means[counter] = mean(sample.data)
}
Okay, before we begin the assignment lets discuss what this script does.
First, it creates two variables, sample.data and sample.means. It assigns these variables the value NA (the empty set).
Second, it creates a loop that loops 100 times.
Third, within the loop, it first creates a sample of random normally distributed data with 10 values, a mean of 300, and a standard deviation of 25.
Fourth, it takes the mean of this new sample and puts it into the variable sample.means in the position that is currently the counter. Thus, on the first iteration of the loop, this would be sample.means[1].
Run the code. You should see that sample.means has 100 elements in it - the means of the 100 samples that were created. Try this: plot(sample.means). You will see a graphic representation of the sample means of your 100 samples.
11. You could compute the variance of these sample means by typing: var(sample.means).
12. You can save this script by hitting the little computer disc button in the script window. You will be prompted to give the script a name.
Assignment Question
Using the code above and the previous assignments, demonstrate that the variance of sample means decreases with increasing sample size. Your submitted assignment must meet the following criteria:
1. You must test the following sample size (5, 10, 50, 100, 1000, 10000).
2. Your test must be of 100 samples of each sample size.
3. You must include a plot of the 6 sets of sample means (HINT: use the par command to make a 2 by 3 figure).
4. You must compute the variance of each of your 6 sets of sample means and report these values.
5. You must include a second figure which is a plot of the 6 variances.
6. You must submit by email a R script file that completes steps 1 through 5. Specifically, I will be able to run the script and see the answers to 1 through 5 as output.
7. In your email, you must also answer in words:
a. The relationship between sample size and variance about the population mean.
b. Explain why variance about the mean decreases with sample size. Do not copy and paste from Wikipedia - use your own words - look at your figures and think about it. Feel free to write an additional script to prove your point mathematically.
c. Explain why this is important experimentally - why is having a bigger sample size better when doing quantitative research?
NOTE. This is your first challenging assignment. It will require quite a bit of thought and work but all of the R commands you need are in these first 5 assignments. I will help you with concepts, but I will not provide you with more code. Also, it is important you learn how to code this assignment yourself. You could find a R expert and they would help you, but on the exam you will need to be able to do something like this on your own.