HOW TO WRITE A RESEARCH PAPER
Writing a research paper is quite challenging and very different from the type of writing that is typically taught in high school or university level English classes. Here, I will review how to write a research paper in sections but first I would encourage you to review a sample research paper I wrote with Dr. Luc Tremblay in 2009. The paper can be found by clicking HERE. I have also attached the Word version HERE so you can see what the "raw" version of a submitted paper looks like.
You will note that a research paper has four core sections - the introduction section, the methods section, the results section, and the discussion section. In front of the introduction there is typically a title page, keyword (for research databases to facilitate search engines), and an abstract. At the end of the paper there is the reference section, footnotes and acknowledgements, tables, figure captions, and then figures. I will note here that different journals have different format requirements and what I am presenting here is the most common format. Science for example, does not follow this standard practice. Papers published in Brain Research have the methods section at the end of the paper. The same holds true for style guides and referencing - a lot of journals use the APA format but a lot do not.
You will note that a research paper has four core sections - the introduction section, the methods section, the results section, and the discussion section. In front of the introduction there is typically a title page, keyword (for research databases to facilitate search engines), and an abstract. At the end of the paper there is the reference section, footnotes and acknowledgements, tables, figure captions, and then figures. I will note here that different journals have different format requirements and what I am presenting here is the most common format. Science for example, does not follow this standard practice. Papers published in Brain Research have the methods section at the end of the paper. The same holds true for style guides and referencing - a lot of journals use the APA format but a lot do not.
How to Write an Introduction
The introduction of a research paper is very important as it introduces the experiment in question (hence the name). Introductions are typically written with three sub-sections:
1. First Paragraphs: The Big Picture Statement - What the experiment is about and why it really matters.
2. Middle Paragraphs: Literature Review - In the middle paragraphs you typically provide a brief review of the literature to frame for readers why what you are doing is an extension of existing work or how it differs from what has been done before. Typically, this part of the introduction is two to three paragraphs in length depending on how much review is warranted (and in the real world, what the maximum word count specified by the journal allows for).
3. Last Paragraphs: Experimental Hypothesis - Here is where you specifically state what your experiment is all about and what you predicted the results would be (and why). Typically, people also briefly describe what the experimental task was.
For example, if you look at the sample paper provided (Krigolson & Tremblay, 2009) you will hopefully see that the first two paragraphs ("The precise role of..." and "an alternative account") frame the study - what is it all about, the so called "Big Picture". If you then read on, the next three paragraphs review the literature on the Specificity of Practice Hypothesis, the "Literature Review". Finally, the paragraphs starting with "The goal of..." and "In line with..." report the experimental hypotheses and predictions.
Let's now review what you have hopefully seen in this paper and the introduction.
The Big Picture: How does feedback processing change with practice? Does reliance upon feedback increase or decrease?
Literature Review: Here, we reviewed the literature to highlight the problem we saw at the time - the vast majority of studies only had two levels of practice (brief, extended) and thus we felt it was really impossible to gauge how feedback reliance changed with practice.
Experimental Hypotheses: In the last two paragraphs we briefly described what we did and what we predicted would happen - and importantly, why we predicted it. We predicted, based on the literature, that we would see an initial decrease in feedback reliance followed by a subsequent increase in reliance.
It is important to note that in larger papers the same pattern holds true. However, the "Literature Review" may be quite extensive with subheadings, etc.
How to Write a Methods Section
Writing a Methods section can be challenging but once you get the hang of it, there is a bit of a formula to it. As with the Introduction there are key sections to a Methods section that must be present:
1. Participants
2. Apparatus / Task
3. Procedure
4. Data Collection
5. Data Analysis.
I will deal with each of these sequentially. Note, these sections are almost always separated with headings and subheadings as needed.
Participants
In the participants section you generally list who you tested and provide descriptive statistics. For example, "Eighteen left-handed males from Newfoundland completed this experiment". Typically, in a sentence or in parentheses you add in either the age range "19 to 25 year olds" or better yet the mean age with a standard deviation score "the mean age was 23.3 +/- 1.2". In addition to age data, typically gender information is provided as well, "18 participants completed this study (8 male, 10 female)". Additional information about participants can be added of course if it is pertinent to the study "no participants had previous experience with the experimental task" and such as long as ethics are not violated, i.e., research participants are almost always protected in confidence so no personal identifiers can be used.
In addition to information about participants typically there is a blanket statement about how ethics approval was obtained and which ethics conventions were being followed. You can find more of that HERE. Look at the sample paper above for an example statement.
Apparatus / Task
In this section you describe the apparatus or task that participants played - it is important to note this is very different than the Procedure in which you describe how they interacted with the apparatus.
So, in an Apparatus section you describe in detail the experimental apparatus. If it is a physical device or setup you provide dimensions, etc if relevant. If it is a purchased item where it came from and what it is. If it is a computer game you describe the manufacturer, etc.
Sadly, there is not much I can give you here other than two pieces of advice:
1. Another person should be able to replicate exactly your apparatus from your description.
2. Find a research paper that uses your apparatus and see what they wrote :) Okay, that is in jest but in all seriousness within a line of research there are accepted descriptions of certain tasks. Indeed, if you already have a published paper with a given task you are allowed to cite it, "In the present experiment we used the same task we employed in a previous related study, see Krigolson et al. 2020 for details.".
Procedure
In the Procedure section you describe exactly what participants did - how they interacted with the apparatus. One way to think of it is that this is where you describe your manipulation of the Independent Variable - the variable that you are manipulating. For example, if you were running a study examining massed versus distributed practice effects (thus you independent variable is type of practice) you need to describe the massed and distributed practice conditions. Also of importance here is how many trials were done, what type of design (within, between), was a block designed used, were there practice trials.
Again, the gold standard here is that other researchers should be able to replicate your experiment by following your Procedure.
Data Collection
The Data Collection section is fairly straightforward - here you need to clearly state how you collected your data, what data was collected, and measurement units. For example, in a study where you are measuring response time - the time to complete a movement - you need to describe the equipment used to measure response time in detail. You also need to define response time and provide the unit of measure you are using, for example, seconds.
Data Analysis
Finally, in the Data Analysis section you need to describe two key things: 1) what processing was done to the data and 2) what statistical analyses were used to generate results. Processing of the data is literally the steps that were taken to move from raw data to the data that was submitted for statistical analysis. For example, you may be taking a mean of trial data over a series of trials for each experimental condition and participant. However, in some instances there are a lot of steps that need to be taken - for instance the pre-processing of functional imaging data is quite complex and requires a fair bit of work before it is ready for analysis (Note: Data Analysis sections of functional imaging papers are quite long, in some behavioural studies this can be done in a sentence!).
As noted, you also need to describe the statistical analyses you used to generate the results - t-tests, confidence intervals, etc. You do not need to start writing out equations!!! List the techniques used, assumptions made, etc.
How to Write a Results Section
The difficulty of writing a results section is wholly dependent on the type of research being conducted. For example, in some of the studies in my laboratory the entire analysis consisted of three t-tests and as such, our results section was typically just a single paragraph or two. However, if your analysis includes discussion of complex statistical models and multiple dependent variables then the results section may span several pages.
Here, I will focus on writing a results section for a short paper with only a few key findings and will only provide some general guidelines to follow.
General Guidelines
1. There should be a paragraph for each variable being analyzed and/or for each statistical test that is being made. For example, if you collected data across five practice sessions and you were interested in learning effects then you would have one paragraph to discuss these learning effects. However, if you did another analysis with this data - for instance, to examine an experimental manipulation like practice type - then you would need a second paragraph to discuss these findings. If you then added a correlation analysis, then you need one more paragraph.
2. Do not interpret data and provide conclusions - that is for the discussion. In a results section you simply describe the experimental results.
3. Having said that, make sure you describe the results in words. For example, in line with the example used in Point 1, you might start by saying: "Our analysis of movement time revealed that it decreased as a function of practice session." Always use words to describe the effects you saw.
4. However, once the words have been used, then you report the statistical results. For example, the second sentence after the one in Point 3 might be: "Specifically, a repeated measures ANOVA revealed...".
5. There is not enough space here to go over how to report every type of statistical test one might use. You will need to consult someone with knowledge, a prior paper, or a statistics text to get this information. The one comment I will make is that in general the formula is: Test(Degrees of Freedom) = Test Score, p statement, effect size. For example, for a t-test this might be "t(14) = 3.2, p < 0.01, Cohen's D = 0.87".
6. The most common statistical convention is to use one of four options for p, for significant findings either state "p < 0.05", "p < 0.01", or "p < 0.001" as appropriate. For non-significant findings use "p > 0.05".
7. Always report an effect size for a statistical test. Always.
8. Never use the phrase "almost significant" or "marginally significant" - an effect is either present or it is not. With that said, never use the word "significant". For example, you should never say, "There was a significant trend in reaction time..." if the p-value is less that 0.05 then you simply write "There was a trend in reaction time". With conventional null-hypothesis testing you either have an effect or you do not, hence the word significant is meaningless or redundant.
9. Report descriptive statistics for all variables you are describing including 95% confidence intervals. Do not use other error measures - see Cumming 2013 if you want to read the argument for CIs. If you do not include the descriptive statistics in the text because there are too many, then you need a table. A figure is simply not enough.
10. Always yoke your results paragraph to a figure. A good rule of thumb is that you should have as many figures as you have results paragraphs.
11. Find a decent results paragraph from a similar paper and follow it as closely as you can.
How to Make Good Figures and Tables
I will start by saying here that you really need to consult an APA manual to do this properly. First, I will provide a checklist of dos and do nots and then I will provide a few sample figures.
1. This is not a time to be creative. Follow accepted conventions and do not use settings that you think are cute.
2. Plot as much data as possible on the graph. If all you have is two column bars with error bars - why bother? Show data, and as stated, as much as possible.
3. No title. Research figures have figure captions - text below them. In a presubmission state these are typically on a separate page after your Reference section entitle "Figure Captions".
4. Label your axes. Make sure you include units for anything that should have units. For example, "Completion Time (s)".
5. Remove tick marks that are not pointing to a label. Some programs insert tick marks all over the place - ditch them.
6. Do not have grid lines.
7. Use the appropriate type of chart - line graphs are for continuous data, column/bar graphs are for discrete/categorical data.
8. You must have error bars. 95% confidence intervals are the only choice (see Cumming, 2013). Use of standard error of the mean and/or standard deviations is inappropriate.
9. Make sure there is a legend if needed.
10. View it at 100%. Your text is probably too small and needs to be larger.
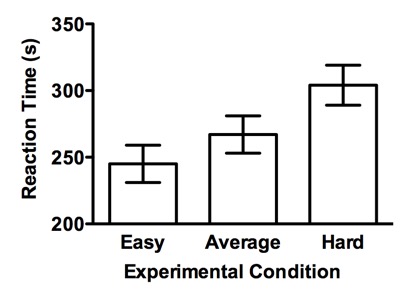
A sample column graph. Note that the axes are labelled clearly, the legend is within the figure as labels for each column. Error bars are clear and easy to see.
How to Write a Discussion
Writing the discussion of a research paper is of course important because this is the bit where you get to tell people what you think. As with the other bits of the paper, there is a bit of a formula to this. Given that this guide is focused on writing a standard length paper, I will maintain that focus here. Essentially, the Discussion has five key paragraphs you need. Note, no subheadings are used with the exception of "Conclusions" for the last paragraph.
Paragraph One: Summarize your findings. Most discussions start with a paragraph that summarizes the key findings in the paper in words. No statistics are used here, but a verbal summary of what the findings were. Be specific and emphasize the key findings related to your hypotheses from the Introduction.
Paragraph Two: What does it mean? In this paragraph you must clearly emphasize how your data clearly support your hypotheses (or how they do not) and ground your results in theory. For example, "Our findings are in line with previous research... ". This is where you need citations - make sure readers know that your findings make sense in terms of both theory and previous work! Note, if you test multiple hypotheses you may need to have two (or more) paragraphs here, one for each hypothesis you test.
Paragraphs Three and Four: Generally, after the initial summary and justification of findings, you move into the big picture. Okay, so what do your results mean in a big picture sense? Do not go overboard - what do you results add to what we know about theory X and how do they go against theory Y. Here is where you frame your findings in the big picture. If your findings are from a study in Motor Learning what do they imply for practice design and learning environments. You may only need one paragraph here.
Paragraph Five: Conclusions. Typically you end with your conclusions. What was the key result. What does it mean. What is the next step / where do you go from here. Keep it short and simple, do not waste words. Think of this as your chance to tell the reader what the study was really all about in three to four sentences.
How to Write the Other Bits and Pieces
Perhaps the simplest thing to do is to examine the Word version of the sample paper above (HERE) to see all of the additional pieces that are needed - but usually in addition to the aforementioned sections a research paper includes: a title page, an abstract, references, and figure captions. There may also be Tables and Figures.
Title Page: Consult the APA manual! But in short, you need to include the title, the full list of authors, the affiliation of the authors, and the corresponding author.
Abstract: Typically abstracts are 150 to 250 words in length. Again, there is a "formula". You have a first sentence to introduce the big idea followed by second and third sentences where you then hone in to focus on your specific study. Next, you have a sentence or two to describe the methods. After this, two sentences to describe the key findings. Finally, one or two sentences to summarize your results and make a big picture statement about what it means.
References: A complete source of all cited references - follow the appropriate style guide - APA, etc. HERE is an overview of the APA citation format.
Figure Captions. A brief caption for each figure is required. Simply state what the figure is showing - do not draw conclusions or state results.
Tables. Tables can be quite tricky. The best thing to do is to exactly replicate the format of a table from another paper. There is a guide to making tables HERE.
Figures. See above.