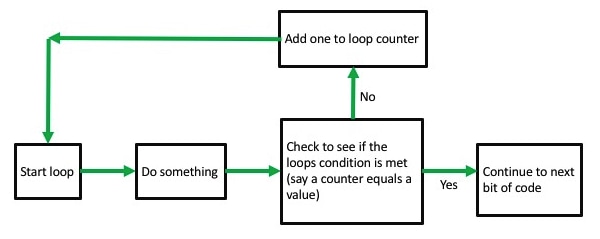
In order to be a good programmer you MUST think logically. Indeed, when I learned to program the first month of the course was done on pen and paper to learn logic flow. For example, the logic of a for loop can be seen as:
A trial can be seen that way as well. As a logical flow of information. Let's start with the logical of a choice reaction time task. We want to draw a square on either the left or the right of the screen and have participants respond to which side it is on by pressing either "a" or "l". We will also compute their reaction time. So, what are the steps we need to do (if we just think about one single trial)?
1. Decide which side we are drawing on, the left or the right, by using a random number.
2. Draw a fixation cross.
3. Wait for some amount of time.
4. Start a reaction time clock.
5. Draw the square in the right spot.
6. Wait for button press.
7. Get reaction time when button pressed.
Now, we could argue about the exact amount of steps we need to do and what they are, but this captures the gist of it. In MATLAB, we would code this trial like this:
% standard opening commands
clc;
clear all;
close all;
rng('shuffle');
% define variables, the keys we want people to respond with (this is from the previous exercise)
% lets define out target keys, this also gets the ASCII or numeric index for they key
k1 = 'a';
k2 = 'l';
keyOne = KbName(k1);
keyTwo = KbName(k2);
% open a drawing window
Screen('Preference', 'SkipSyncTests', 1);
[window, window_size] = Screen('OpenWindow', 0, [0 0 0], [],32,2);
% figure out where the middle of the screen is
x_mid = window_size(3)/2;
y_mid = window_size(4)/2;
% define the rectangle that will be the left square and the right square
% recall this is just four values, the x and y coordinates of the top left and bottom right
stimulus_size = 50;
distance_from_middle = 200;
left_top_x = x_mid - distance_from_middle - stimulus_size;
left_top_y = y_mid - stimulus_size;
left_bottom_x = x_mid - distance_from_middle + stimulus_size;
left_bottom_y = y_mid + stimulus_size;
left_square = [left_top_x left_top_y left_bottom_x left_bottom_y];
right_top_x = x_mid + distance_from_middle - stimulus_size;
right_top_y = y_mid - stimulus_size;
right_bottom_x = x_mid + distance_from_middle + stimulus_size;
right_bottom_y = y_mid + stimulus_size;
right_square = [right_top_x right_top_y right_bottom_x right_bottom_y];
% do not panic, work through what these values are - they just refer to two squares
% figure out where we are drawing the square
stimulus_side = rand(1);
if stimulus_side <= 0.5
drawn_square = left_square;
else
drawn_square = right_square;
end
% I am going to use Formatted Text to draw the fixation + sign
Screen(window,'TextFont','Arial');
Screen(window,'TextSize',40);
DrawFormattedText(window, ['+'],'center', 'center', [255 255 255],[],[],[],2);
% never forget to flip!
Screen('Flip',window);
% wait for some amount of time, between 400 and 700 ms
random_delay = 0.4 + rand(1)*0.3;
WaitSecs(random_delay);
% start a reaction time clock
tic;
% draw the target square
Screen('FillRect', window , [255 255 255], drawn_square);
% redraw the fixation cross, the flip command erases all previously draw items
DrawFormattedText(window, ['+'],'center', 'center', [255 255 255],[],[],[],2);
% never forget to flip!
Screen('Flip',window);
% wait for the response
while 1
% read the current status of the keyboard
[keyIsDown, secs, keyCode] = KbCheck;
% this returns some key information
% keyIsDown is a variable that is a 1 if a key is pressed and 0 if no key is pressed
% secs is the time of the key press
% keyCode is a vector for each key, a 1 will appear in the vector for the key that has been pressed
% this is a logic test, if the value of keyCode corresponding to 'a' is pressed
if keyCode(keyOne) == 1
reaction_time = toc;
break;
end
if keyCode(keyTwo) == 1
reaction_time = toc;
break;
end
end
% close the drawing window
Screen('CloseAll');
disp(['The reaction time was: ' num2str(reaction_time)]);
This code is also HERE. Indeed, I would strongly recommend typing this in - if you copy and paste you will have problems. Also, I have added some stuff to my code to improve it you might like to see!
STOP. Go line by line through the code. Make sure you know what it does. If not, go back and review previous assignments. There is no point moving forward unless you are clear with what is happening here.
In the next assignment we are combing this with for loops to simulate trials so it is important you understand what is done here.
Things to Do
1. Try changing the location of the target squares.
2. Try changing the colour of the target squares.
3. Try changing the delay in the fixation cross.
4. Try switching to circles.
5. Try replacing the squares with a jpeg image.