KRIGOLSON TEACHING
  • NEUROSCIENCE
    • NEUROSCIENCE 100 >
      • NEURO 100 INTRODUCTION
      • NEURO 101 ADVANCED
      • NEURO 102 AGING
      • NEURO 103 MEMORY
      • NEURO 104 DECISION MAKING
      • NEURO 105 LEARNING
      • Research Statistics
    • NRSC 500B / MEDS 470
  • Kinesiology
    • EPHE 245
    • EPHE 357
  • STATISTICS
    • BIOMEDICAL STATISTICS
    • MULTIVARIATE STATISTICS >
      • MULTIPLE REGRESSION
    • RESOURCES
    • R TIPS
  • MATLAB
    • THE BASICS >
      • Hello World
      • BASIC MATHEMATICS
      • VARIABLES
      • Matrices
      • Writing Scripts
      • PATHS AND DIRECTORIES
      • USER INPUT
      • FOR LOOPS
      • WHILE LOOPS
      • IF STATEMENTS
      • RANDOM NUMBERS
    • STATISTICS >
      • LOADING DATA
      • DESCRIPTIVE STATISTICS
      • MAKING FUNCTIONS
      • BAR GRAPHS
      • LINE GRAPHS
      • TTESTS
    • EXPERIMENTS: THE BASICS >
      • DRAWING A CIRCLE
      • DRAWING MULTIPLE OBJECTS
      • DRAWING TEXT
      • DRAWING AN IMAGE
      • PLAYING A TONE
      • KEYBOARD INPUT
      • BUILDING A TRIAL
      • BUILDING TRIALS
      • NESTED LOOPS
      • RIGHT OR WRONG
      • SAVING DATA
    • EXPERIMENTS: ADVANCED >
      • STROOP
      • N BACK
      • Oddball
      • Animation
      • VIDEO
    • EEG and ERP Analysis >
      • ERP Analysis
      • FFT Analysis
      • Wavelet Analysis
  • Directed Studies
    • Advanced Topics in Motor Control A
    • Advanced Topics in Motor Control B
    • An Introduction to EEG
    • Advanced EEG and ERP Methods
    • Neural Correlates of Human Reward Processing
    • Independent Research Project
  • RESOURCES
    • EXCEL
    • HOW TO READ A RESEARCH PAPER
    • HOW TO WRITE A RESEARCH PAPER
  • Workshops
    • Iowa State EEG Workshop 2018
  • Python
    • The Basics >
      • Setting Up Python
      • Hello, world!
      • Basic Math & Using Import
      • Variables
      • Matrices
      • Scripts
      • User Input
      • For Loops

3D. HISTOGRAMS

Picture
​Again, we will work with the same data as before. Load the data HERE into a table named data. Name the columns subject, group, and rt.

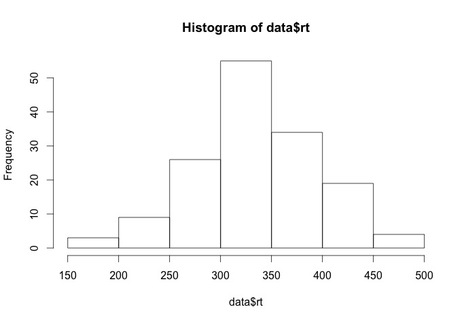
Generating a histogram is very easy in R. Try the following:

hist(data$rt)


What you will see is a simply histogram like this.

Histograms provide an excellent representation of your data. For example, you could use something like the bar plot we generated a few exercises ago or you could show something like this:

​
hist(data$rt[data$group==1],col=rgb(1,0,0,0.5),ylim = c(0,25))
hist(data$rt[data$group==3],col=rgb(0,0,1,0.5),ylim = c(0,25),add=T)


Now this plot only overlays groups 1 and 3 but you get the idea - there is a lot more information here than a simple bar plot.

You can also pull information out of a histogram. Try:
stuff = hist(data$rt)
stuff


As with the boxplot command, you will see that the histogram generates a lot of statistical information.

For a list of all the properties of a histogram, use
?hist

Note, all of the classic plot properties such as titles, axis labels, and axis limits can be set.

  • NEUROSCIENCE
    • NEUROSCIENCE 100 >
      • NEURO 100 INTRODUCTION
      • NEURO 101 ADVANCED
      • NEURO 102 AGING
      • NEURO 103 MEMORY
      • NEURO 104 DECISION MAKING
      • NEURO 105 LEARNING
      • Research Statistics
    • NRSC 500B / MEDS 470
  • Kinesiology
    • EPHE 245
    • EPHE 357
  • STATISTICS
    • BIOMEDICAL STATISTICS
    • MULTIVARIATE STATISTICS >
      • MULTIPLE REGRESSION
    • RESOURCES
    • R TIPS
  • MATLAB
    • THE BASICS >
      • Hello World
      • BASIC MATHEMATICS
      • VARIABLES
      • Matrices
      • Writing Scripts
      • PATHS AND DIRECTORIES
      • USER INPUT
      • FOR LOOPS
      • WHILE LOOPS
      • IF STATEMENTS
      • RANDOM NUMBERS
    • STATISTICS >
      • LOADING DATA
      • DESCRIPTIVE STATISTICS
      • MAKING FUNCTIONS
      • BAR GRAPHS
      • LINE GRAPHS
      • TTESTS
    • EXPERIMENTS: THE BASICS >
      • DRAWING A CIRCLE
      • DRAWING MULTIPLE OBJECTS
      • DRAWING TEXT
      • DRAWING AN IMAGE
      • PLAYING A TONE
      • KEYBOARD INPUT
      • BUILDING A TRIAL
      • BUILDING TRIALS
      • NESTED LOOPS
      • RIGHT OR WRONG
      • SAVING DATA
    • EXPERIMENTS: ADVANCED >
      • STROOP
      • N BACK
      • Oddball
      • Animation
      • VIDEO
    • EEG and ERP Analysis >
      • ERP Analysis
      • FFT Analysis
      • Wavelet Analysis
  • Directed Studies
    • Advanced Topics in Motor Control A
    • Advanced Topics in Motor Control B
    • An Introduction to EEG
    • Advanced EEG and ERP Methods
    • Neural Correlates of Human Reward Processing
    • Independent Research Project
  • RESOURCES
    • EXCEL
    • HOW TO READ A RESEARCH PAPER
    • HOW TO WRITE A RESEARCH PAPER
  • Workshops
    • Iowa State EEG Workshop 2018
  • Python
    • The Basics >
      • Setting Up Python
      • Hello, world!
      • Basic Math & Using Import
      • Variables
      • Matrices
      • Scripts
      • User Input
      • For Loops