In this assignment you will learn to run a Factorial ANOVA. Load the data HERE into a table called data. Rename the columns "subject, age, gender, rt".
data = read.table("sample_anova_data.txt")
names(data) = c("subjects","age","gender","rt")
This data reflects reaction time data taken from 120 participants in three age groups (old, middle, young) subdivided into two gender groups (female, male). If you look at the data, you will note that the subject numbers go from 1 to 120 with no subject numbers repeated indicating a between subjects design.
First, as ever, you would have to conduct the appropriate tests of assumptions - normality and homogeneity of variance. But, let us leave that for now till after the ANOVA.
The linear model for a factorial ANOVA has to include both main effects (age, gender) and the interaction between age and gender. It would look like this:
rt = data$rt
age = factor(data$age)
gender = factor(data$gender)
model = aov(rt ~ age + gender + age*gender)
summary(model)
Which should give you this:
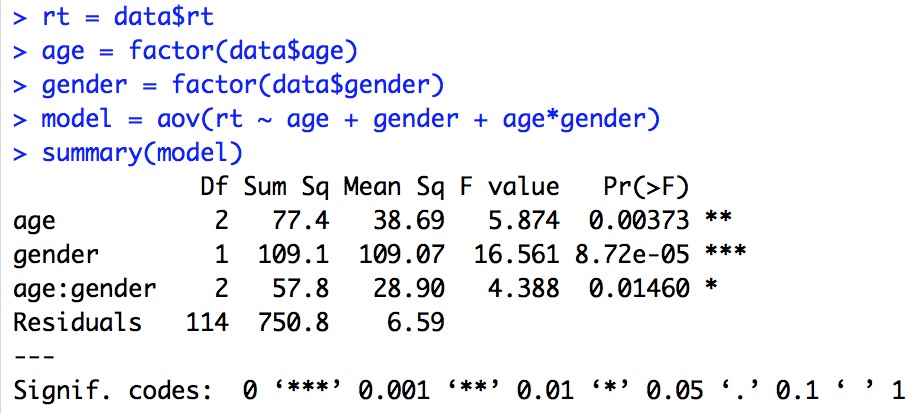
The results are straight forward - there is a main effect for age, a main effect for gender, and an interaction between age and gender.
Before we move on, lets get back to the assumptions. Try the following:
plot(model)
This will generate four plots, seen in sequence by hitting return. The interpretation of these plots if beyond this tutorial - see Field 12.5.13 for more detail. Alternatively, you could use one of the strategies that we have discussed previously.
Now, to examine the main effects of age and gender and the interaction visually:
plot(rt ~ age)
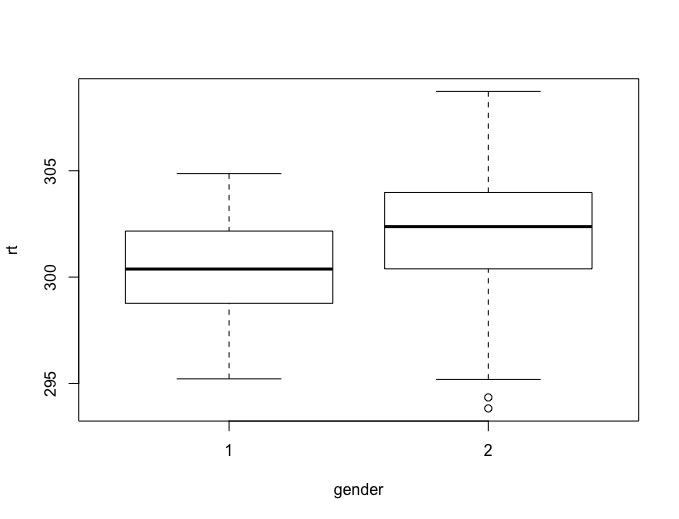
plot(rt ~ gender)
interaction.plot(age,gender,rt)
Before we move on, lets get back to the assumptions. Try the following:
plot(model)
This will generate four plots, seen in sequence by hitting return. The interpretation of these plots if beyond this tutorial - see Field 12.5.13 for more detail. Alternatively, you could use one of the strategies that we have discussed previously.
Now, to examine the main effects of age and gender and the interaction visually:
plot(rt ~ age)
plot(rt ~ gender)
interaction.plot(age,gender,rt)

|
|
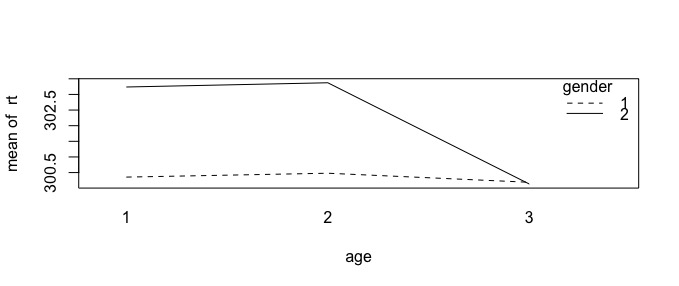
You will see that group 3 (young) appears to have faster reaction times then groups 1 (old) and 2 (middle). You will also see that females appear to have faster reaction times than males. However, these main effects are misleading when you look at the interaction plot. The interaction plot suggests rt is the same for all females (gender = 1) but is slower for older and middle aged men.
To verify this, you need to do a posthoc analysis of the main effects of age and gender and the interaction.
TukeyHSD(model)
To verify this, you need to do a posthoc analysis of the main effects of age and gender and the interaction.
TukeyHSD(model)
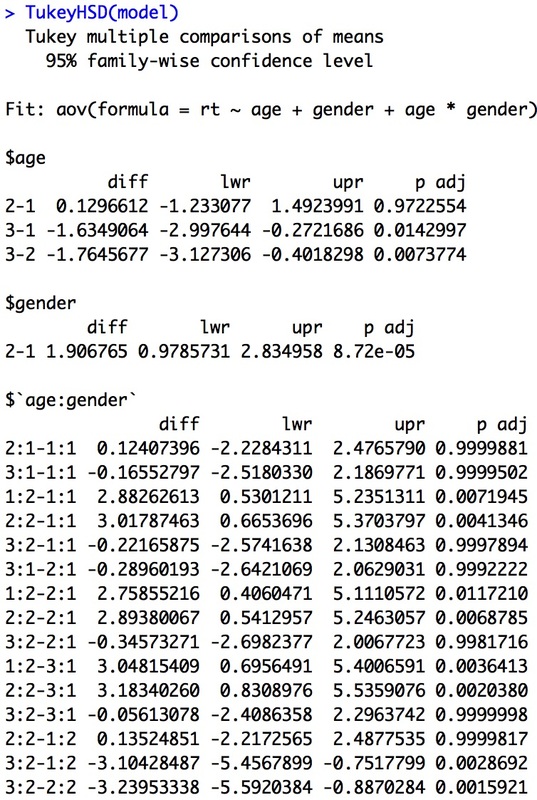
You can see easily that the TukeyHSD test compares all the main effects. But, it also compares all the cells which makes for a lot of comparisons. It also does not really tell us the story of the interaction plot. So, this is just one way to post-hoc a factorial ANOVA.
A simpler way to posthoc the ANOVA would be the following. Pick a direction: Age or Gender. If you pick Age, then you can run an independent samples t-test at each level of age to see where the difference lies.
age1 = subset(data,age==1)
t.test(age1$rt~age1$gender)
age2 = subset(data,age==2)
t.test(age2$rt~age2$gender)
age3 = subset(data,age==3)
t.test(age3$rt~age3$gender)
If you do this, you will see that the first two t tests are significant, the third is not. This tells us the nature of the interaction - rt differs between genders at ages 1 and 2 but not at 3. You will note, we have also done a lot less tests to show this effect.
Note, you could have done this the other way and run two ANOVAs, one when gender == 1 and one when gender == 2. If you do this, you will find that the ANOVA for gender = 1 is not significant and the ANOVA for gender = 2 is. You could then posthoc the second ANOVA to tell the story of the interaction plot.
gender1 = subset(data,gender==1)
model1 = aov(gender1$rt~factor(gender1$age))
summary(model1)
TukeyHSD(model1)
gender2 = subset(data,gender==2)
model2 = aov(gender2$rt~factor(gender2$age))
summary(model2)
TukeyHSD(model2)
The direction you take - to pull apart gender or age is wholly dependent on the story that you wish to tell. Both are true, but by convention you generally only pick one direction.