CORRELATION
Load the data HERE into a table called data.
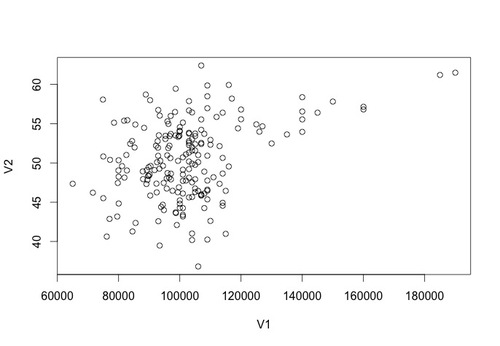
Let's plot the data using the following command: plot(data)
You should see something that looks like the plot to the right.
In statistics, sometimes we interested in the relationship between two variables. For example, is there a relationship between income and happiness? Is there a relationship between average hours of sleep per night and grade point average?
To test the extent of a relationship in statistics we use correlation. A Pearson correlation analysis return a number, "r", between -1 and 1 that represents the extent of a relationship. Positive numbers reflect a relationship wherein both the X and Y variables increase concomitantly. Negative numbers reflect a relationship wherein while one number variable increases the other decreases. A Pearson value of 0 suggests there is no relationship. However, the following relationship "strengths" are typically used:
0.1 to 0.3 = Weak correlation
0.3 to 0.5 = Medium correlation
0.5 to 1.0 = Strong correlation
The same ranges are true for negative correlations.
Returning a correlation value in r is very easy. Try: cor(data$V1,data$V2)
You will see that there is a medium strength correlation of 0.3585659 between these two variables.
In addition to interpreting correlations using the above ranges you can also use a formal statistical test against the null hypothesis. You do this by typing: cor.test(data$V1,data$V2)
You should see that the p value in this case is less than 0.001 indicating that the correlation of the sample differs from zero.
Assignment
1. The data HERE contains 6 columns of numbers. Test the correlation between column 1 and the other columns. Report both the relationships as defined above and also the p values for each correlation test.